According to Uptime Institute’s 2022 Global Data Center Survey, 63% of operators believe authorities in their region will require data center teams to publicly report environmental data in the next five years. Yet, most operators do not even collect this data, with only 37% collecting and reporting emissions data and 39% reporting water usage.
Whether you’re just getting started tracking sustainability efforts or you started with a sustainable design from the get-go, we can all agree that maximizing energy efficiency and tracking resource usage is best for the environment, your budget, and your data center’s business counterpart.
If you’re considering enhancing your sustainability efforts, keep reading for ideas on how to track environmental data and improve data center energy efficiency using physics-based simulation.
How to Calculate Data Center Energy Efficiency and Cost Savings
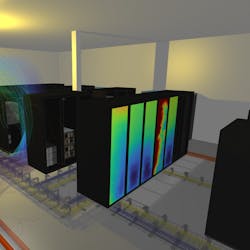
The first step to improving data center energy efficiency is to start tracking environmental data if you don’t do so already. Tracking this data doesn’t have to be difficult. For example, 6SigmaDCX, Cadence’s physics-based simulation for data centers, provides the Room Energy Efficiency Report.
Tools like the Room Energy Efficiency Report provide a power usage breakdown of the power system, cooling system, and IT equipment to help analyze data center power consumption. You'll want the tool to also calculate power usage effectiveness (PUE), a commonly used ratio of the energy used by the facility compared to the energy used by IT equipment. Annual energy cost and overall room efficiency are critical data points as well. With 6SigmaDCX, these findings can be accessed via both the design software and an operational web tool.
When your data center digital twin model is connected to environmental monitoring systems, it's important that both the model and the reporting can be continuously updated with real-time data. The reports can be used to demonstrate data center efficiency over time, which makes reporting this data to your business counterpart or governing bodies more streamlined and straightforward.
After establishing a method for tracking environmental data, operators can begin calculating potential energy savings. Optimizing data center cooling infrastructure is one of the most common and effective means to improve efficiency, ranking in the top two drivers for sustainability gains by operators in the Uptime Institute’s 2022 Global Data Center Survey.
Improving cooling infrastructure performance is easier said than done. Cooling is challenging to visualize, let alone predict. Furthermore, one wrong move can result in catastrophic consequences for IT equipment temperatures.
That’s why you want a product suite like 6SigmaDCX that comes with a Potential Savings Calculator, which calculates the potential energy savings possible when increasing the chilled water setpoint with a choice of three scenarios—no room temperature change, retaining the room safety margin, or assuming no room safety margin. Operators can realize significant energy and financial savings when they increase their chillers’ chilled water setpoint, and products like 6SigmaDCX provide a safe, virtual environment to finetune this process before implementation.
How to Calculate Your Data Center’s Carbon Footprint
The surest way to understand your data center’s environmental impact over time is to calculate its carbon footprint. The latest 6SigmaDCX release—Release 17—calculates and reports on the data center’s total IT carbon footprint.
The total carbon footprint calculation includes the sum of all IT equipment embodied carbon and operational carbon usage. Individual IT equipment has an associated embodied carbon that accounts for carbon emissions from the device's manufacturing processes, transportation, and end-of-support.
In 6SigmaDCX, this data is stored in our IT equipment library items, using manufacturer data or estimated embodied carbon of 85kgCO2e per kilogram. If users already have this information, they can manually set each device’s embodied carbon.
The operational carbon usage accounts for the carbon dioxide emitted when generating energy to directly power the IT equipment in the data center. This includes factoring in the IT equipment’s product lifetime, IT power requirements, and the amount of carbon dioxide emitted to make a unit of electricity known as utility carbon intensity.
In 6SigmaDCX, carbon footprint data is available in the design software and operational web tool, so both data center designers and operators can be aware of their data center’s environmental impact.
Learn More
While sustainability regulations and standards are still only looming for many, getting a handle on environmental initiatives right now will help data center teams improve energy efficiency and further streamline the data analytics side of operations with data center management software.
Mark Fenton is Product Marketing Manager at Cadence Design Systems. Learn more about Cadence's latest 6SigmaDCX software release.


